
Do you want to become a successful trader? No matter if you trade forex, commodities, stocks, indices or cryptocurrencies, you must be able to correctly forecast the future exchange rate of a particular asset and the following strategy will help you with that.
No trader can predict the future market development with the 100% successful rate. Long-term results are important.
The strategy I am about to show you is optimised for maximised profit, but by using it, I am trying to easily explain the basic principle of trading strategies.
Disclaimer: Since I am not a licensed investment advisor, I am obliged to inform you that the purpose of this strategy is purely educational. Nevertheless, it can help you when creating your own strategies. Apart from forex, you can you use this strategy at CFD trading with cryptocurrencies, indices, stock and commodities.
74% of retail investor accounts lose money when trading CFDs with this provider. You should consider whether you can afford to take the high risk of losing your money.
Trading Basics
I will show you the strategy on the XTB broker platform, you can open a demo account for free (you just need to fill in your email, password and phone number for registration) and you can follow my steps. 74% of retail investor accounts lose money when trading CFDs with this provider. Before we proceed to the actual strategy, it is important to know the basic terminology.
Currency pairs exchange rates
Currency pairs exchange rates tell us how much of one currency is needed to buy another currency. For instance, if we have the EUR/USD currency pair with the exchange rate of 1,07617, for one Euro you can buy 1,07617 of US dollar ( €1 = $1,07617). The same principle works for stock, commodities and indices.
Price chart
Shows us the development of a currency pair exchange rate for a certain interval.
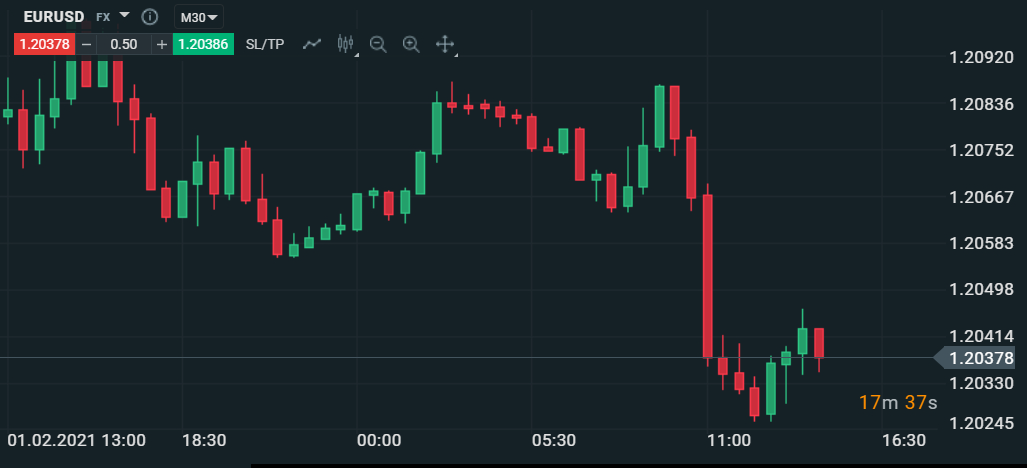
As you can see in the picture, the right side shows exchange rate values, the bottom part has details about time and in the middle, there are “Japanese candlesticks”, sometimes referred to as “candles”.
Japanese candlesticks
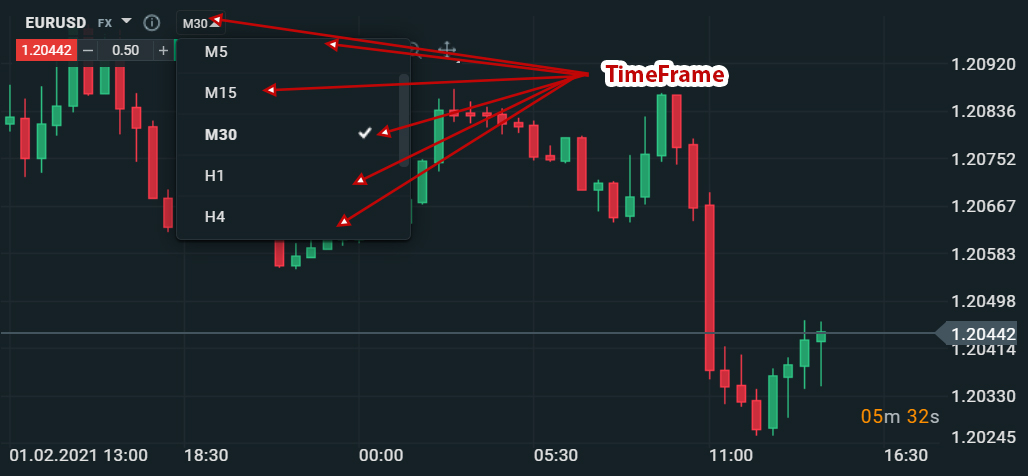
For the right understanding of the chart, it is necessary to know how the candlestick chart works. Each candle represents a figure for a certain interval, such as 5 min (M5), 15 min (M15), 30 min (M30), 1 hour (h1), 4 hours (h4) etc., this interval is called Time Frame. The Time Frame selection can be found in the upper part of the chart, each strategy can work differently with a different Time Frame.
Closely look at the picture below which demonstrates the candlesticks function. Each candle has its open price, it is the price immediately after the candle formation has begun. After that, the candle is shaping based on the market changes; the candle body (where the candle is wide) gives us the total change within the interval, while the top of the candle represents the opening or closing price. The tiny lines determine the maximal and minimal exchange rate during the candle formation.
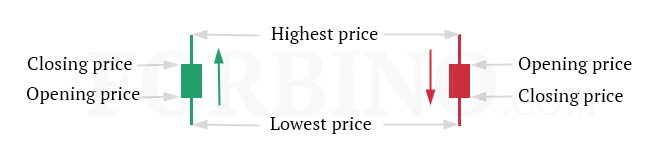
You may have noticed that the candles in both the chart and the picture above have two different colours, green and red. The colour determines whether the candle is rising or falling. A rising candle (green) has the final price higher than the opening one, which means the exchange rate rises and the candle body rises alongside with it. On the contrary, a red candle is falling. A different platform can have different colours depending on the settings, I take this example from the XTB platform where the rising candle is green and the falling one is red.
IndicatFors
Indicators are mathematical calculations based on historical data drawn into a chart. Most indicators depend only on previous price and time. However, there are also indicators which take into account the volume of trades. There is a wide range of indicators to be found, we will use the Bollinger bands indicator in this strategy.
Bollinger bands
Bollinger Bands have three bands and the price is roughly 95% of the time between the top and the bottom band. We will implement Bollinger bands into our strategy, they will give us a signal for entering or leaving the trade. The signal for entering will be a touch (or a near touch) with a Bollinger band border.
Besides this basic information, it is good to study more in the forex for beginners article, it will be particularly useful to know what the Pip unit means. But for the following strategy, you will suffice with the information from this article.
Tested forex strategy
The principle of this forex strategy is to successfully predict when the currency exchange rate turns around to take the advantage and make a profit on it. It is only a simple strategy designed for educational purposes with the aim to show how it is possible to make your own strategies.
Open your (demo) account at XTB and you will see this on the homepage:
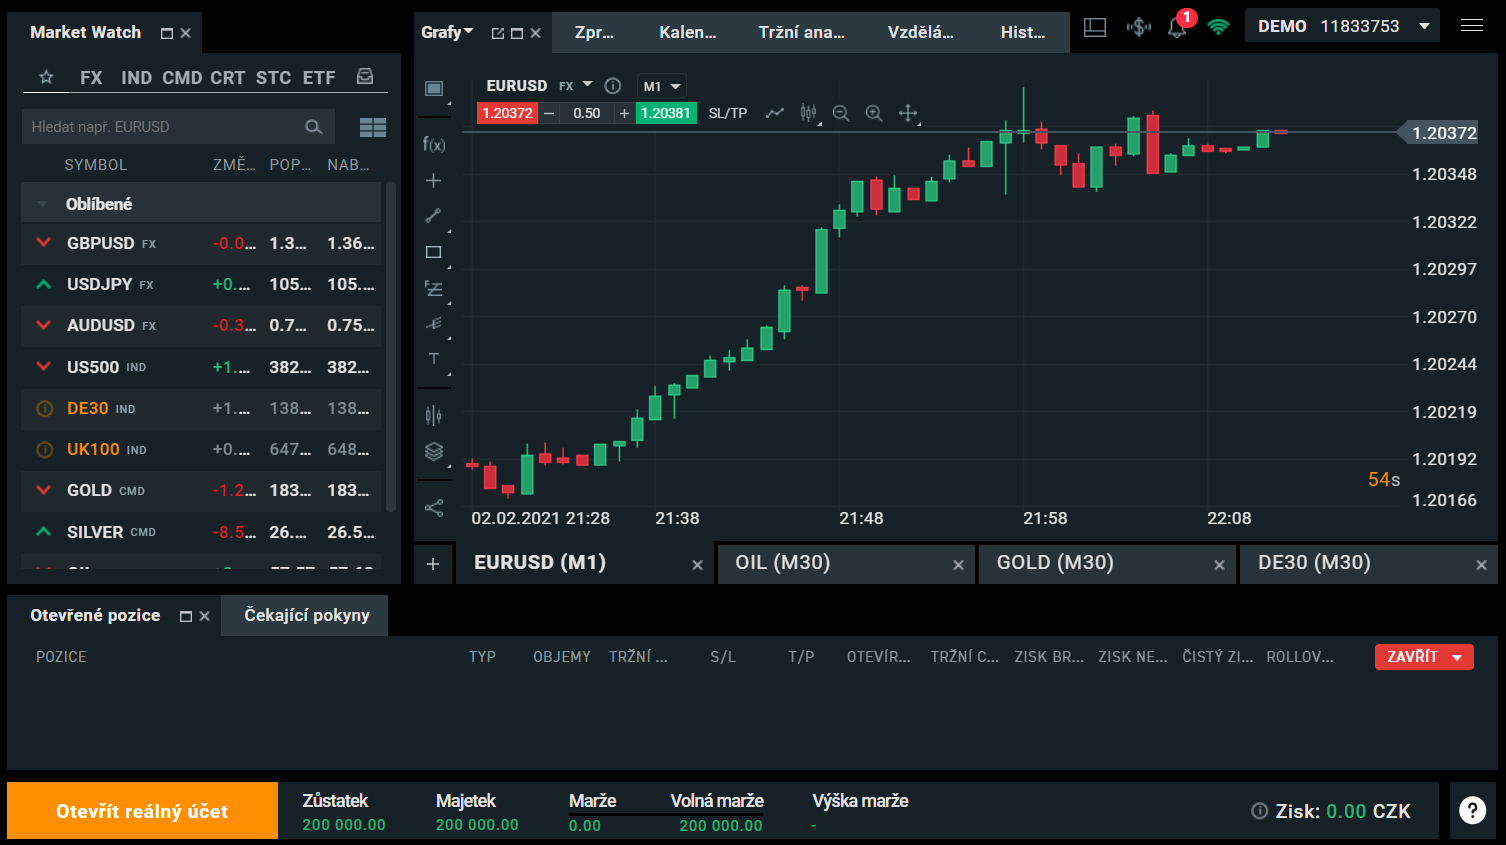
As you can see, I have opened the EUR/USD currency pair, but for this CFD trading strategy, you can select anything else, for example, Bitcoin, oil or stock.
Enter Bollinger bands
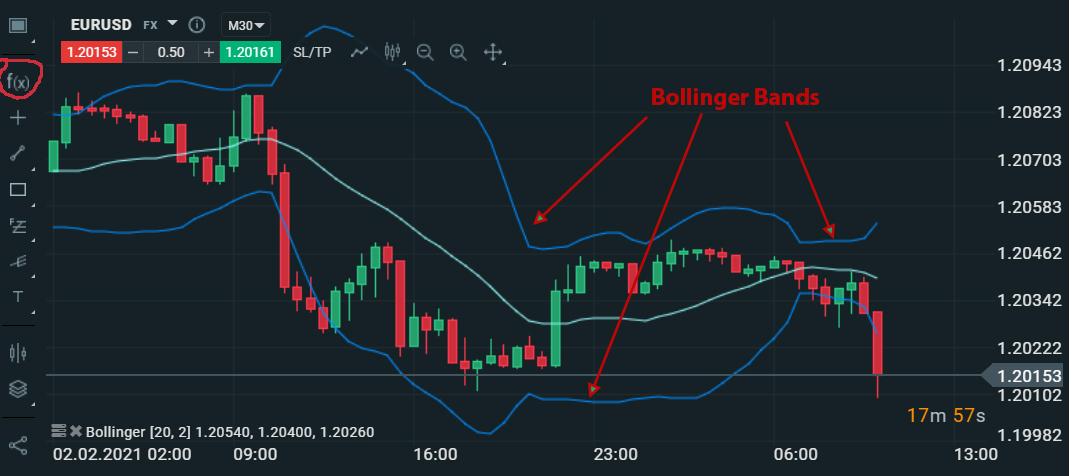
In the top left corner, you can find the f(x) button, see the picture. Click on it, search for Bollinger band and in the basic settings, you will add Bollinger bands into the chart, later an indicator will be drawn like in the following picture.
As you can see from the picture, the Bollinger bands are formed of three bands. For the purposes of this strategy, we will be using only the top and the bottom band.
What Time Frame to set
It is up to you. You can freely try what will suit you best. Trades with short time frames are faster and vice versa. I personally use a 30-minute-long time frame for this strategy.
When to enter the trade
- If the candle touches or nearly touches the bottom band, wait for another candle and if it is a rising one (green), open the trade with the BUY order.
- If the candle touches or nearly touches the top band, wait for another candle and if it is a falling one (red), open the SELL position.
The picture above shows that the last candle reached the bottom Bollinger band, if a green candle followed, suggesting a rising trend, I would open the BUY position.
Tip: It rarely happens that after opening a currency pair chart, there is an ideal candlestick formation, that’s why it is important to go through more currency pairs (cryptocurrencies, stock) and look for the right formation. Using the XTB broker, if you add an indicator to one chart, it will be automatically shown in others, which will considerably make the process faster.
How long can you leave the position open?
Basically, you have three options:
- In advance, set “Close at profit” (Take Profit) and “Close at loss” (Stop Loss) – the position will automatically close when reaching one of the values.
- Close the trade manually
- Use Trailing Stop (the explanation can be found in the follow-up article)
If you choose option 1 or 2, you still need to know when to close the position. You can do so easily. There are more options, such as identifying the point when the market turns around and setting these values for closing the position.
In this example strategy, I am doing it this way:
Using the bottom Bollinger band:
- Take profit: Between the middle Bollinger band and the upper band, circa in the ⅔ of the middle band.
- Stop loss: Half of the pips compared to Take profit – it is easily visible in the trading platform.
Using the upper Bollinger band:
- Take profit: Between the middle Bollinger band and the bottom band, circa in the ⅔ of the middle band.
- Stop loss: Half of the pips compared to Take profit – it is easily visible in the trading platform.
Is this trading strategy profitable in practice?
This trading strategy is for educational purposes to provide an easy understanding of how forex strategies are made. However, it doesn’t mean this strategy is useless in practice. The strategy successful rate can be improved by using another indicator or candlestick formation such as Hammer or Shooting Star formation. This strategy is sufficient for beginning, now it is important to open a demo account and use the strategy with no risks and to adjust it at your discretion.
Written by Josef Kuchař, the owner of forbino.com. The XTB broker is a partner of this article. All information provided comes from my own experience and knowledge.
| Broker | English | Min. deposit | Spread EUR/USD* | Platforms | License | |
|---|---|---|---|---|---|---|
 | 10 USD | 0,9 pips Spread was taken 17.07.2026 at 11:12 from the web or trading platform of Iux. | MT5, IUX Trade App, IUX WebTerminal | ASIC, FSCA, FSC MU | iux.com review EUR/USD*: 0,9 pips Spread was taken 17.07.2026 at 11:12 from the web or trading platform of Iux. | |
 | 100 USD | 1.0 pips Spread was taken 17.07.2026 at 11:12 from the web or trading platform of Etoro. | In-house built platform | FCAASICCySec | etoro.comreview EUR/USD*: 1.0 pips Spread was taken 17.07.2026 at 11:12 from the web or trading platform of Etoro. | |
 | 0 | 0.9 pips Spread was taken 17.07.2026 at 11:12 from the web or trading platform of XTB. | In-house built platform | FCA CySec | xtb.comreview EUR/USD*: 0.9 pips Spread was taken 17.07.2026 at 11:12 from the web or trading platform of XTB. 74% of retail investor accounts lose money when trading CFDs with this provider |
* The spread is variable for most brokers and changes depending on market volatility.